Traffic Analysis for 1 -- APEnlaceSaucilloProvidencia
| System: | APEnlaceSaucilloProvidencia in Saucillo |
| Maintainer: | aorta@smart.net.mx |
| Description: | eth1_emac1 |
| ifType: | ethernetCsmacd (6) |
| ifName: | eth1_emac1 |
| Max Speed: | 125.0 MBytes/s |
| Ip: | No Ip (No DNS name) |
The statistics were last updated Thursday, 22 October 2026 at 12:01,
at which time 'APEnlaceSaucilloProvidencia' had been up for 8 days, 13:51:44.
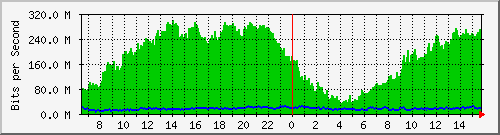
`Daily' Graph (5 Minute Average)
|
Max |
Average |
Current |
| In |
288.5 Mb/s (28.9%) |
131.7 Mb/s (13.2%) |
146.7 Mb/s (14.7%) |
| Out |
22.2 Mb/s (2.2%) |
9928.2 kb/s (1.0%) |
9271.5 kb/s (0.9%) |
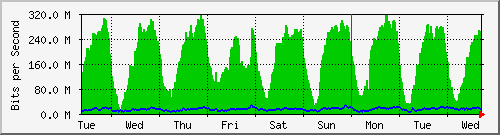
`Weekly' Graph (30 Minute Average)
|
Max |
Average |
Current |
| In |
307.9 Mb/s (30.8%) |
153.1 Mb/s (15.3%) |
129.6 Mb/s (13.0%) |
| Out |
24.0 Mb/s (2.4%) |
10.6 Mb/s (1.1%) |
8815.0 kb/s (0.9%) |
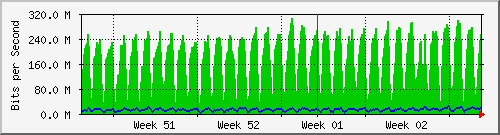
`Monthly' Graph (2 Hour Average)
|
Max |
Average |
Current |
| In |
293.0 Mb/s (29.3%) |
157.2 Mb/s (15.7%) |
100.7 Mb/s (10.1%) |
| Out |
23.3 Mb/s (2.3%) |
10.8 Mb/s (1.1%) |
6601.7 kb/s (0.7%) |
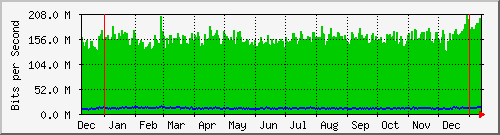
`Yearly' Graph (1 Day Average)
|
Max |
Average |
Current |
| In |
209.2 Mb/s (20.9%) |
163.1 Mb/s (16.3%) |
151.0 Mb/s (15.1%) |
| Out |
16.6 Mb/s (1.7%) |
11.3 Mb/s (1.1%) |
11.7 Mb/s (1.2%) |
| GREEN ### |
Incoming Traffic in Bits per Second |
| BLUE ### |
Outgoing Traffic in Bits per Second |


